As described in Section 9.1, smoking rates among those living in the most disadvantaged areas of Australia are double those living in the most advantaged areas. While smoking has declined in all socioeconomic groups over the past several decades, progress has varied.1 For the period of 2013–16, the greatest (and only significant) reduction in prevalence occurred among the most disadvantaged smokers, while for the most recent period of 2016–19 prevalence declined only among the fourth and fifth quintiles (i.e., the least disadvantaged—see Section 9.2).
An important consideration in the development of public health policy is whether tobacco control strategies are as effective in reaching low socio-economic and other vulnerable groups as they are in reducing smoking among more advantaged people.2-6 Carefully designed population-level interventions have the capacity to reduce smoking-related disparities; however to avoid inadvertently widening inequalities, strategies need to be cognisant of systemic biases, individual and environmental influences on smoking, and existing inequities.6-8 For example, larger investment in tobacco control in California compared to the rest of the US appears to have been most effective at reducing smoking among non-Hispanic White people. While reductions in the prevalence of smoking were not as large there has been a notable reduction in consumption among African Americans in California.9 Researchers have identified 24 constructs encompassing individual, environmental and structural factors associated with smoking among racial/ethnic minority and lower-income groups and developed a diagram showing how these factors influence each other:


Figure 9.8.1 Causal loop diagram of smoking with individual, environmental and fundamental factors
Much of the gain in reducing smoking prevalence is attributable to tobacco control policies, such as high taxes, public education campaigns and increasingly widespread smokefree regulations. These policies serve to promote public health (for both smokers and for those exposed to secondhand smoke) and change social norms, whereby smoking becomes increasingly less affordable and acceptable.10 In Australia, reducing socio-economic disparities in smoking is a high priority for tobacco control policy units, health promotion organisations, and social marketing campaigns. One of the key priority areas of Australia’s 2012–18 National Tobacco Strategy was strengthening efforts to reduce smoking among populations with a high prevalence of smoking. It outlines a number of aims to achieve this, including population-based approaches such as social marketing campaigns, tax increases, and smokefree legislation, as well as ensuring access to individual cessation support.11 Reducing disparities and disadvantage is also subject of state-based tobacco control initiatives, such as the Cancer Council NSW Tackling Tobacco Program.12 The Victorian Health Promotion Foundation (VicHealth) has developed a framework as part of its Fair Foundations program that provides policy makers and practitioners with practical, evidence-based guidance on reducing inequities in health caused by tobacco use.13 Reducing smoking among disadvantaged groups is also a key priority for Quit Victoria.14
There is robust evidence that population-wide strategies such as graphic anti-smoking advertisements and increases in taxes on cigarettes have reduced smoking across all socio-economic groups. Research in Europe concluded that tobacco control policies, both price and non-price related, have helped to reduce the prevalence of smoking in the total population, particularly in lower socioeconomic groups. Such policies may therefore have contributed to a certain degree of narrowing in the gap between advantaged and disadvantaged groups.15 One review similarly concluded that increasing the price of tobacco through taxation polices and continuing anti-smoking mass media campaigns are the most effective strategies to reduce inequities in tobacco use,16 and another found that price/taxation measures and targeted cessation support had the strongest evidence for reducing disparities.17
This section summarises evidence about the relative impact of population-level tobacco control strategies on various socio-economic status (SES) groups:
9.8.1 Impact of mass media
A 2012 review of the impact of mass media campaigns on smoking cessation concluded that higher exposure appears to confer greater benefit on socioeconomically disadvantaged population subgroups, particularly messages that confer the negative health effects of smoking.18 It is difficult to assess the impact of population-level policies such as media campaigns through conventional meta-analyses, and such reviews19-21 have reported mixed findings.17, 22 Research in the US found that exposure to mass media campaigns was associated with smoking cessation behaviours among all SES groups: there were no differences by sociodemographic characteristics, thus the campaigns did not appear to exacerbate disparities in quitting.23-27 Media campaigns can however enhance equity if delivered via channels that have the greatest reach among smokers in priority groups. For example, two population-based studies in the United States found that increasing the intensity of exposure of a general mass media campaign within these priority communities significantly boosted the communities’ campaign recall compared to communities receiving a standard campaign dose.28, 29 An evaluation of a national adult mass media campaign with increased campaign intensity also found quit attempts to be more likely among smokers with lower levels of education in higher-dose media markets than smokers with lower levels of education from standard dose media markets.28 See also, effects on uptake among young people, Section 9.8.6 below.
Taking into account all of the available evidence (not just randomised controlled trials and cohort studies) the National Cancer Institute concluded in 2017 that campaigns with: high exposure, targeted media efforts; additional tobacco-related program components; or language-appropriate and/or culturally tailored messaging can be effective and may reduce potential communication inequalities that lead to gaps in tobacco-related knowledge. Additionally, campaigns with graphic and emotionally arousing messages can also stimulate quitting among racial/ethnic minorities and low-SES groups.21 Such campaigns may also be most effective they form part of a comprehensive tobacco control program that includes comprehensive smokefree legislation, tax increases, and targeted cessation support.18, 30, 31 Given the enormous changes in the media environment over the past decade, including an increasing shift to digital and online viewing and social media, researchers have highlighted the importance of future research that examines how best to reach and influence smokers, especially those in high prevalence populations.32
A detailed discussion on the impact of mass media can be found in Chapter 14, Section 14.4
9.8.1.1 Impact of mass media in reducing disparities in smoking-related knowledge
In Australia, television advertising has been extremely effective in raising awareness of the health effects of smoking among blue collar and less educated groups. In the mid-1980s, people with limited formal education and blue collar workers were much more likely than people with post-school qualifications and white collar workers to believe that no illnesses were caused by smoking, and that some illnesses were helped by smoking.33, 34 However, studies monitoring the impact of the Quit Campaign introduced in Victoria in 198535 and the National Tobacco Campaign introduced across Australia in 199736-39 indicate a steady increase in knowledge among people with all levels of education about the health effects of smoking—such as emphysema, heart disease, stroke, and macular disease—which were the subject of television commercials used in the campaigns (see Chapter 14, sections 14.3.1.2 and 14.4.4 for a detailed discussion on the impact of the National Tobacco Campaign in Australia).
Data from wave 5 (2006) of the International Tobacco Control Four Country Survey indicated that over 90% of people reported having noticed publicity on television on smoking in the last six months, with no differences in level of awareness between groups with various levels of educational attainment.40
However, disparities are more pronounced in the case of health conditions that have not been the subject of television commercials. Data from wave 5 of the International Tobacco Control Policy Four Country Survey evaluation study indicated, for instance, that Australians with a university education were only 4% more likely than people who had not finished high school to agree with the proposition that smoking causes stroke (a subject of anti-smoking television campaigns in NSW and Victoria in 2007).40 However, they were 15% more likely to agree that smoking causes impotence, a topic which, although covered in newspaper articles, has never been the subject of a television commercial or package health warning in Australia (Figure 9.8.2).
Figure 9.8.2 Proportion of smokers 18 years and over agreeing that smoking causes stroke (subject of TV advertisement) and impotence (subject of newspaper stories but not TV advertising), Australia, 2006, by educational attainment
Source: Data file provided to Michelle Scollo of the Tobacco Control Unit, Cancer Council Victoria, by Cooper J and Borland R: responses to fifth wave of the International Tobacco Control Four-country Survey, by educational attainment and income adjusted for household size, unpublished data, 2008
Data from Wave 8 (2010–11) of the International Tobacco Control Four-Country Survey provides a comparison to the earlier findings of Wave 5 (2006). Although health knowledge appears to have decreased somewhat— particularly so in relation to respondents agreeing that smoking causes impotence—trends by education have remained relatively consistent between survey waves—see Figure 9.8.3.
For a timeline of Australian social marketing campaigns see Chapter 14, Section 14.3.
Figure 9.8.3 Proportion of smokers 18 years and over agreeing that smoking causes stroke and impotence, Australia, 2010–11, by educational attainment
9.8.1.2 Impact of mass media campaigns on smoking prevalence across socio-economic groups in Australia
There is strong evidence that exposure to mass media campaigns reduces tobacco uptake and promotes quitting.41 Quit campaigns in Australia have targeted media placement (both in terms of timing and program and program type) and pre-tested advertisements among low-SES groups to ensure that they are equally effective among such groups.42-47
Several Australian studies have examined the effects of mass media campaigns on disadvantaged groups. An examination of trends in smoking prevalence over the course of Australia’s first major National Tobacco Campaign showed an equal impact across socio-demographic groups, suggesting a more pronounced effect on those with blue-collar occupations (who had a much higher smoking prevalence).39 Victorian research also suggests that an accelerated decrease in the prevalence of regular smoking among low SES people may be attributable to increases to tobacco taxation as well as increased funding for social marketing campaigns.48
Two Australian studies have found that exposure to anti-smoking advertisements increased quitline calls by the same degree across each socioeconomic group.38, 49 Further, one found that there were substantially greater increases in calls to quitline from low socioeconomic groups when higher emotion narrative ads were on air.49
Emotionally evocative ads, and ads that contain personal stories about the effects of smoking and quitting, appear to be particularly effective among lower income groups.49, 50 An Australian study examined the impact of anti-smoking advertisements evoking different emotions on advertisement effectiveness among different socioeconomic groups. It found that evoking multiple negative emotions (fear, guilt, and/or sadness), but not evoking hope, may be particularly useful in motivating those living in lower socioeconomic areas to quit. Fear messages alone were similarly effective across both socioeconomic groups.51 Another study found that fear-evoking tobacco control campaigns in Australia were equally effective across socioeconomic groups in increasing smokers' perceptions of family and friends' disapproval of their smoking.52
See Chapter 14, sections 14.3 and 14.4 for a detailed discussion on the impact of mass media led campaigns across socio-economic groups in Australia and internationally.
9.8.2 Impact of price increases on low-income groups in Australia
Before April 2010, excise and customs duty on tobacco products had not increased in real terms in Australia since November 1999. On 30 April 2010, the Australian Government raised the excise on tobacco products by 25%, and further annual increases of 12.5% commenced in 2013, making Australian cigarettes among the most expensive in the world (see Section 13.3). Research on the impact of price increases on prevalence has generally found higher responsiveness to price among lower socio-economic groups,20, 22, 53-63 and several major reviews provide strong evidence that increased tobacco price via tax is the intervention with the greatest potential to reduce socioeconomic inequalities in smoking.17, 20, 21, 57, 64-67 Among people who were still smoking at the end of the first phase of the National Tobacco Campaign in Australia (May 1997 to November 1999), the prevalence of smoking decreased more among blue than white collar groups during the second phase of the campaign (November 1999 to November 2002) when prices of tobacco products increased significantly. Smoking declined by 6.1% in blue collar groups and increased by 0.9% in white collar groups.68
An analysis of smoking prevalence in response to changes in cigarette prices in Australia between 1991 and 2006 similarly found a strong association between price increases on cigarettes and declines in prevalence, which was more pronounced in lower-income groups. One Australian dollar increase in cigarette price was associated with declines of 2.6%, 0.3% and 0.2% in the prevalence of smoking in low, medium, and high-income groups, respectively.69 Victorian research also suggests that an accelerated decrease in the prevalence of regular smoking among low SES people may be attributable to increases to tobacco taxation (as well as increased funding for social marketing campaigns).48
In 2010, an 25% increase in tobacco tax was implemented in Australia, followed by a series of four 12.5% annual tobacco tax increases from 2013 onward. A study examining month-to-month changes in prevalence of current smoking associated with these measures found that both were effective in the short- and longer-term. There was a larger immediate reduction in smoking among the lower SES group in response to the 2010 tax than the higher SES group; however the results also showed an increase in the use of roll-your-own tobacco among lower SES smokers. This indicates that price-sensitive smokers may have switched to using a cheaper product in response to the tax increases, and highlights the need for taxes to be harmonised across products (See Section 13.3.1.4).70
A detailed discussion on the impact of tobacco price increases on low-income groups can be found in Chapter 13, Section 13.11.
9.8.3 Impact of smokefree policies
Smokefree workplace policies reduce the amount of tobacco smoked, reduce exposure to secondhand smoke, increase rates of quitting, and reduce the chance of a quitter relapsing.71 The initial introduction of smokefree policies generally resulted in greater benefits for higher income and educational groups,57 likely because such policies were adopted earlier in white collar environments. While smokefree legislation reduces social inequalities in secondhand smoke exposure at work,72 and reduces smoking-related mortality in lower socioeconomic groups,73, 74 evidence on their effectiveness for reducing socioeconomic inequalities in smoking prevalence is mixed. Some research has concluded that smoking bans are more effective in promoting quitting and reducing smoking among more advantaged groups, and can therefore widen socioeconomic inequalities,17, 57, 75-79 while others find that smokefree legislation can contribute to a reduction in inequalities by encouraging quitting,80-83 the adoption of smokefree homes,84 an reductions in exposure to secondhand smoke85 among those with a lower socioeconomic status. There may also be differences in the effects of smokefree laws between specific racial/ethnic minorities.86 Several studies have also found comprehensive smokefree laws to be equally effective across all socioeconomic groups.87, 88 A 2016 Cochrane review of legislative smoking bans found some evidence of reductions in smoking prevalence among lower socioeconomic groups, but notes the inconsistency of the findings.73 More recent research in Europe found that smokefree policies were more strongly related to lower smoking prevalence among older people with lower rather than higher levels of education.61
All Australian states and territories have now implemented bans on smoking in enclosed workplaces, including in hospitality venues (see Chapter 15). Many Australian states and territories have extended smokefree policies to cars carrying children, and to outdoor areas, such as playgrounds and outdoor dining areas (see Section 15.7). Victorian research found that significantly more persons in the lower socio-economic group (measured by educational attainment) reported smoking less after the introduction of smokefree hospitality venues compared to those of higher socio-economic status (40% compared with 24%).83 Overall, national, comprehensive smokefree policies are more effective at reducing inequities than voluntary, regional, and partial policies.22, 89
People on lower incomes are more likely to allow smoking inside their home (see Section 9.1). Government tobacco control policies appear to have positive flow-on effects for the adoption of smokefree policies in people’s homes, with European research finding a positive association between the strength of national policies and in-home smoking bans.90 The increasing introduction of smokefree policies in apartment buildings may also be particularly effective in reducing secondhand smoke exposure among disadvantaged groups (see Section 15.6). 91
See also Section 15.9.3.3 for a discussion of the effects of smokefree legislation on reducing socioeconomic disparities in smoking
9.8.4 Impact of pictorial health warnings
Pictorial health warnings appear to be at least as effective among disadvantaged as more advantaged smokers,22, 57 and are more effective than text-only warnings.92 This may be due to a greater ease of understanding, as well as their emotionally evocative content, which is a particularly effective strategy among disadvantaged groups.92
Results from the International Tobacco Control Four-country Survey showed that pictorial health warnings introduced in Australia in 2006 were noticed more frequently among less educated smokers than among smokers with a university education (see Figure 9.8.4).
Figure 9.8.4 Percentage of smokers rarely and frequently reading new pictorial health warnings on cigarette packets, smokers 18 years and over, Australia 2006, by level of educational attainment
Source: Data file of responses to the fifth wave of the International Tobacco Control Four-country Survey, by educational attainment and income adjusted for household size, provided to Michelle Scollo of the Tobacco Control Unit, Cancer Council Victoria, by J Cooper and R Borland Cancer Council Victoria, 2008.
The proportion of smokers who noticed the new warnings often or very often was 10% higher among those who had not finished high school than among those smokers with a university education. While low-SES smokers were no more likely than high-SES smokers to report thinking about the harms of smoking as a result of looking at the warnings, they were more likely to report forgoing cigarettes. Graphic warnings may therefore be somewhat more effective among lower than higher SES groups in prompting quitting behaviours. Data from Wave 8 (July 2010–May 2011) of the International Tobacco Control (ITC) Four-country Survey show that, although less pronounced, those with lower education levels were still slightly more likely to report noticing the health warnings often or very often (see Figure 9.8.5).
Figure 9.8.5 Percentage of smokers reporting reading or looking closely at the health warnings on cigarette packets in the past month, smokers 18 years and over, Australia, July 2010–May 2011, by educational attainment
Source: Data file of responses eighth wave of the International Tobacco Control Four-country Survey, provided to Merryn Pearce of the Tobacco Control Unit, Cancer Council Victoria, by T Partos and R Borland, Cancer Council Victoria, 2012.
Since the 1 st of December 2012, cigarette packs sold in Australia must be drab, dark brown in colour and devoid of all brand design, and must carry larger, graphic health warnings. An experimental study prior to implementation of plain packaging found that plain packs were rated as significantly less appealing than branded packs among socioeconomically disadvantaged smokers, and such packs also reduced purchase intentions.93 Research post-implementation among Indigenous Australians found that plain packaging had reduced misperceptions that some brands are healthier than others. Compared with pre-plain packaging, younger Aboriginal and Torres Strait Islander peoples were less likely to view some brands as more prestigious than others.94 See InDepth 11A for a detailed discussion of plain packaging research.
9.8.5 Impact of bans on advertising, promotion and sponsorship
Controls on tobacco advertising, promotion, and marketing appear to be equally or more effective among disadvantaged groups.22 However, in the wake of bans on traditional forms of tobacco advertising, such as on TV and in magazines, the tobacco industry has found ways to circumvent such bans and continue to target current and potential smokers. For example, current laws in Australia fail to adequately prevent online promotion (see Section 11.11), or certain product- and price-related forms of marketing. As noted in Section 9.8.6, adolescents are particularly vulnerable to online advertising, and even more so when they are from a disadvantaged background.95-97 Ensuring that tobacco advertising bans are inclusive of Internet-based media is essential for preventing exposure and uptake among the most disadvantaged young people.95
Price-related marketing, such as discounts and price boards, particularly targets young and low-income smokers and undermines the effectiveness of tax increases.98, 99 Price-sensitive smokers are able to switch brands or products in order to minimise the effect of increases in excise tax. In order to reduce socioeconomic disparities in smoking prevalence, researchers have proposed a three-pronged strategy: substantial specific excise tax increases alongside minimum price laws and bans on coupons and price promotions.98
9.8.5.1 Impact of retail promotion and access
The display, advertising, and accessibility of tobacco products in retail outlets are associated with uptake, smoking, and relapse.100-102 While all Australian states and territories have banned tobacco marketing and display in retail outlets, such restrictions do not reduce the availability of tobacco products. There is a clear inverse association between SES and tobacco retailer density, such that the density of tobacco outlets tends to be higher in areas with lower average incomes.103, 104 Further, not all Australian states require tobacco retailers to obtain a license prior to selling. Across stores in 122 postcodes in metropolitan and regional areas, study auditors in NSW found that retailers in low-socioeconomic status (SES) areas were significantly more likely than those in less disadvantaged areas to be unlisted and to breach in-store retailing laws.105 Licensing of retailers could contribute to reducing tobacco related disparities by ensuring that retailers in disadvantaged areas comply with laws that aim to reduce smoking uptake and relapse. See Section 11.9 and InDepth 11B for a detailed discussion.
9.8.6 Reducing uptake among disadvantaged children in Australia
Along with increasing rates of cessation among adult smokers, preventing uptake among disadvantaged children forms an important part of reducing disparities in smoking prevalence. Encouragingly, over the 2000s, smoking rates have reduced among Australian school students across all socioeconomic groups, and generally show a convergence in prevalence (see Section 9.2).
There is very limited evidence internationally on the effectiveness of public education campaigns on disadvantaged young people.106-108 A 2016 review concluded that public education campaigns are generally effective in reducing tobacco use among young people, however there was insufficient to determine whether campaign outcomes differ by socioeconomic status.109 The 2012 US Surgeon General’s report on preventing tobacco use among young people concluded that the limited research has not found any systematic differences in responses to anti-tobacco ads by gender, race/ethnicity, or nationality. It notes that the characteristics of advertisements appear to be more important to campaign effectiveness than the characteristics of the audience.106 More recently however, US research found that exposure to an anti-smoking campaign was associated with the greatest reduction in youth smoking behaviours among those in lower socioeconomic status group.110
A large study of adolescents across 29 European countries found that tobacco prices were effective in decreasing smoking among boys, regardless of their socioeconomic status.111 Another European study similarly found that stronger tobacco control policies were associated with lower smoking rates, with no significant difference in this association between high- and low-SES adolescents.112 As with adults, in Australia, socio-economic trends in smoking prevalence among children appear to reflect overall levels of tobacco-control funding and taxation policy. A study of smoking among school children between 1987 and 2005 indicated that smoking prevalence decreased in all SES groups.113 However, the level of funding tobacco-control mass media education campaigns affected the consistency of change across different SES groups, particularly in teenagers aged 12–15 years, the period of peak smoking uptake. As indicated in Table 9.8.1, in the period of low tobacco-control media campaign funding and activity in Australia (1992–1996), smoking prevalence increased among students aged 12–15 years, with the greatest increase among low-SES students. In a period of high tobacco-control media campaign funding (1997–2005), by contrast, smoking decreased quite sharply and reductions were consistent across SES groups.
Table 9.8.1 Absolute changes in reported smoking prevalence among students aged 12–15 years during high and low periods of tobacco-control media campaign funding, Australia, 1987–1990, 1990–1996 and 1996–2005, in schools in various socio-economic status quartiles
|
Socio-economic status quartiles
|
Absolute change
|
|
1987–90
|
1990–96 low activity
|
1996–2005 high activity
|
|
Phase 1 (%)
|
Phase 2 (%)
|
Phase 3 (%)
|
|
Monthly smokers
|
|
Lowest
|
–1
|
+6
|
–12
|
|
Second
|
–2
|
+3
|
–10
|
|
Third
|
0
|
+1
|
–12
|
|
Highest
|
–1
|
+1
|
–13
|
|
Current smokers (smoked in past week)
|
|
Lowest
|
–1
|
+5
|
–11
|
|
Second
|
–2
|
+2
|
–9
|
|
Third
|
–1
|
+1
|
–10
|
|
Highest
|
+1
|
–1
|
–11
|
|
Committed smokers (smoked on three days in past week)
|
|
Lowest
|
0
|
+2
|
–7
|
|
Second
|
–1
|
+2
|
–6
|
|
Third
|
0
|
0
|
–7
|
|
Highest
|
–1
|
0
|
–7
|
Source: White, Hayman and Hill 2008 113
Young people are particularly vulnerable to tobacco advertising, and it can differentially affect those in priority populations. Australian research examining exposure to Internet-based tobacco advertising and branding among young people found that participants from lower socioeconomic status were more likely to report exposure,95 and marketing and promotions can be particularly influential in promoting tobacco use among at-risk teenagers.96, 97 Reducing young people’s ability to access tobacco products is also an important component of reducing uptake (see Section 5.21). In the US, Tobacco 21 (T21) was legislation implemented in 2019, raising the minimum age for sale of tobacco products from 18 to 21 years. The national law helped to address disparities in coverage, whereby local T21 laws were less common in lower socioeconomic areas.114 Nonetheless, a recent study assessed compliance with T21 laws among retailers and found that lower compliance was recorded in more impoverished neighbourhoods, regardless of the level of awareness of the policy. In order to avoid exacerbating disparities, the authors highlight the need for additional resources and surveillance in low-income areas.115 Research in Europe has also found that proxy sales (i.e., using an adult to buy cigarettes for an underage person) are a common method of obtaining cigarettes among disadvantaged young people.116
Adolescents with weak bonds to parents, school and other community institutions are at increased risk of engaging in risky behaviours, including smoking,117-123 and the prevention of educational failure in children has been cited as a critical step in preventing smoking uptake. In Australia, children who predict that they will complete Year 12 are much less likely to have ever tried smoking.124 Young people who do well at school are more likely to understand health risks, and are more likely to feel connected to school and to feel hopeful about their future. This increases the possibility of further education and higher occupation status, which are associated with lower levels of smoking (see Section 9.2). Research in Britain estimated that reducing adverse childhood experiences and improving educational attainment are almost as effective in reducing premature mortality as reduced smoking in adulthood.125 Government initiatives that address educational disparities, such as universal, high quality early-childhood education and funding and policies that promote equity in the Australian school system, are likely to reduce educational disadvantage and in turn may reduce smoking. Increasing social cohesion and improving disadvantaged neighbourhoods may also reduce smoking among young people.126-129
See Chapter 5 for a detailed discussion of influences on the uptake and prevention of smoking, and Section 8.4.3 for a discussion of influences on smoking behaviour among Aboriginal and Torres Strait Islander young people.
9.8.7 Summary of factors that could help to reduce tobacco related disparities
Figure 9.8.6 provides an overview of social policies and tobacco strategies that can reduce uptake among disadvantaged children, in turn reducing socioeconomic disparities in smoking. Figure 9.8.6 also includes interventions that could potentially reduce disparities in cessation behaviour and adult smoking prevalence. These are discussed further in Section 9.9.
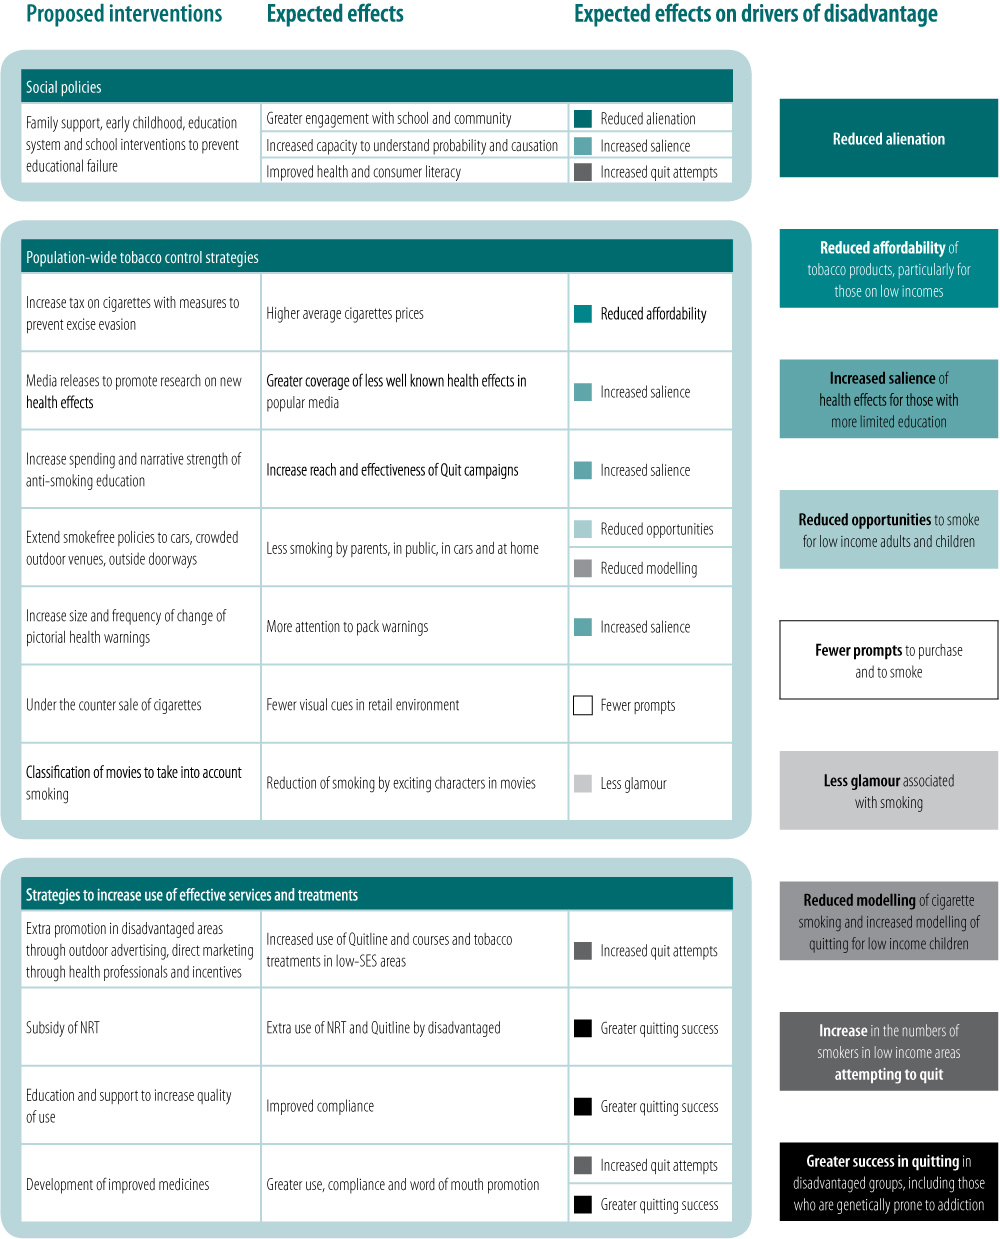
Figure 9.8.6 Interventions that could balance the factors promoting SES differentials in tobacco use
Relevant news and research
For recent news items and research on this topic, click here. ( Last updated November 2022)
References
1. Greenhalgh E, Bayly M, Brennan E, and Scollo M. The great socioeconomic smoking divide: Is the gap widening in Australia, and why? Tobacco Prevention & Cessation, 2018; 4(Supplement). Available from: http://dx.doi.org/10.18332/tpc/90484
2. Baum F. Cracking the nut of health equity: Top down and bottom up pressure for action on the social determinants of health. Promot Educ, 2007; 14(2):90–5. Available from: https://www.ncbi.nlm.nih.gov/pubmed/17665710
3. Zhu SH, Hebert K, Wong S, Cummins S, and Gamst A. Disparity in smoking prevalence by education: Can we reduce it? Glob Health Promot, 2010; 17(1 Suppl):29–39. Available from: https://www.ncbi.nlm.nih.gov/pubmed/20595352
4. Niederdeppe J, Kuang X, Crock B, and Skelton A. Critical steps in building the evidence base regarding media campaign effects on disadvantaged populations: A response to fagan. Social Science & Medicine, 2008; 67(9):1359–60. Available from: www.elsevier.com/locate/socscimed
5. Fagan P. Examining the evidence base of mass media campaigns for socially disadvantaged populations: What do we know, what do we need to learn, and what should we do now? A commentary on niederdeppe’s article. Social Science & Medicine, 2008; 67(1356-8). Available from: www.elsevier.com/locate/socscimed
6. Cwalina SN, Ihenacho U, Barker J, Smiley SL, Pentz MA, et al. Advancing racial equity and social justice for black communities in US tobacco control policy. Tobacco Control, 2021. Available from: https://www.ncbi.nlm.nih.gov/pubmed/34526408
7. Khan Z and Siddiqi K. Population-level interventions and health disparities: The devil is in the detail. Nicotine & Tobacco Research, 2021; 23(12):1985–6. Available from: https://www.ncbi.nlm.nih.gov/pubmed/34498697
8. Mills SD, Golden SD, O'Leary MC, Logan P, and Hassmiller Lich K. Using systems science to advance health equity in tobacco control: A causal loop diagram of smoking. Tobacco Control, 2021. Available from: https://www.ncbi.nlm.nih.gov/pubmed/34535509
9. Sakuma KK, Pierce JP, Fagan P, Nguyen-Grozavu FT, Leas EC, et al. Racial/ethnic disparities across indicators of cigarette smoking in the era of increased tobacco control, 1992-2019. Nicotine & Tobacco Research, 2021; 23(6):909–19. Available from: https://www.ncbi.nlm.nih.gov/pubmed/33196799
10. Graham H. Smoking, stigma and social class. Journal of Social Policy, 2012; 41(01):83–99. Available from: http://dx.doi.org/10.1017/S004727941100033X
11. Intergovernmental Committee on Drugs, National tobacco strategy 2012–2018. Commonwealth of Australia; 2012. Available from: http://www.nationaldrugstrategy.gov.au/internet/drugstrategy/publishing.nsf/Content/national_ts_2012_2018.
12. Cancer Council NSW. Tackling tobacco: Action on smoking and disadvantage. NSW, Australia 2012. Available from: http://askthequestion.com.au/tackling-tobacco/.
13. VicHealth. Reducing tobacco-related health inequities. Victorian Health Promotion Foundation, 2015. Available from: https://www.vichealth.vic.gov.au/media-and-resources/publications/the-vichealth-framework-for-health-equity.
14. Quit Victoria. Strategic plan. 2016. Available from: http://www.quit.org.au/about/strategic-plan.html
15. Hu Y, van Lenthe FJ, Platt S, Bosdriesz JR, Lahelma E, et al. The impact of tobacco control policies on smoking among socioeconomic groups in nine European countries, 1990-2007. Nicotine & Tobacco Research, 2017; 19(12):1441–9. Available from: https://www.ncbi.nlm.nih.gov/pubmed/27613922
16. Purcell KR, O'Rourke K, and Rivis M. Tobacco control approaches and inequity--how far have we come and where are we going? Health Promotion International, 2015; 30 Suppl 2:ii89–101. Available from: https://www.ncbi.nlm.nih.gov/pubmed/26420813
17. Smith CE, Hill SE, and Amos A. Impact of population tobacco control interventions on socioeconomic inequalities in smoking: A systematic review and appraisal of future research directions. Tobacco Control, 2020. Available from: https://www.ncbi.nlm.nih.gov/pubmed/32994297
18. Durkin S, Brennan E, and Wakefield M. Mass media campaigns to promote smoking cessation among adults: An integrative review. Tobacco Control, 2012; 21(2):127–38. Available from: https://www.ncbi.nlm.nih.gov/pubmed/22345235
19. Bala MM, Strzeszynski L, and Topor-Madry R. Mass media interventions for smoking cessation in adults. Cochrane Database of Systematic Reviews, 2017; 11(11):CD004704. Available from: https://www.ncbi.nlm.nih.gov/pubmed/29159862
20. Hill S, Amos A, Clifford D, and Platt S. Impact of tobacco control interventions on socioeconomic inequalities in smoking: Review of the evidence. Tobacco Control, 2014; 23(e2):e89–97. Available from: https://www.ncbi.nlm.nih.gov/pubmed/24046211
21. National Cancer Institute. Monograph 22: A socioecological approach to addressing tobacco-related health disparities. Division of Cancer Control and Population Sciences: NCI, 2017. Available from: https://cancercontrol.cancer.gov/brp/tcrb/monographs/22/index.html.
22. Brown T, Platt S, and Amos A. Equity impact of population-level interventions and policies to reduce smoking in adults: A systematic review. Drug and Alcohol Dependence, 2014; 138:7–16. Available from: https://www.ncbi.nlm.nih.gov/pubmed/24674707
23. Colston DC, Cho B, Thrasher JF, Titus AR, Xie Y, et al. Anti-smoking media campaigns and disparities in smoking cessation in the United States, 2001-2015. American Journal of Health Promotion, 2021; 35(5):658–68. Available from: https://www.ncbi.nlm.nih.gov/pubmed/33415988
24. Niederdeppe J, Fiore MC, Baker TB, and Smith SS. Smoking-cessation media campaigns and their effectiveness among socioeconomically advantaged and disadvantaged populations. American Journal of Public Health, 2008; 98(5):916-24. Available from: https://pubmed.ncbi.nlm.nih.gov/18381998/
25. Niederdeppe J, Kuang X, Crock B, and Skelton A. Media campaigns to promote smoking cessation among socioeconomically disadvantaged populations: What do we know, what do we need to learn, and what should we do now? Social Science & Medicine, 2008; 67(9):1343-55. Available from: https://pubmed.ncbi.nlm.nih.gov/18691793/
26. Blake KD, Willis G, and Kaufman A. Population prevalence and predictors of self-reported exposure to court-ordered, tobacco-related corrective statements. Tobacco Control, 2020; 29(5):516. Available from: http://tobaccocontrol.bmj.com/content/29/5/516.abstract
27. Vallone DM, Ilakkuvan V, Xiao H, Cantrell J, Rath J, et al. Contextual influences and campaign awareness among young adults: Evidence from the national truth® campaign. Behavioral Medicine, 2015; 41(3):155-63. Available from: http://dx.doi.org/10.1080/08964289.2015.1036832
28. McAfee T, Davis KC, Shafer P, Patel D, Alexander R, et al. Increasing the dose of television advertising in a national antismoking media campaign: Results from a randomised field trial. Tobacco Control, 2017; 26:19-28. Available from: http://tobaccocontrol.bmj.com/content/early/2015/12/08/tobaccocontrol-2015-052517.abstract
29. Duke JC, Vallone DM, Allen JA, Cullen J, Mowery PD, et al. Increasing youths' exposure to a tobacco prevention media campaign in rural and low-population-density communities. American Journal of Public Health, 2009; 99(12):2210-6. Available from: http://www.ncbi.nlm.nih.gov/pubmed/19833994
30. Levy DT, Chaloupka F, and Gitchell J. The effects of tobacco control policies on smoking rates: A tobacco control scorecard. J Public Health Manag Pract, 2004; 10(4):338–53. Available from: https://www.ncbi.nlm.nih.gov/pubmed/15235381
31. Niederdeppe J, Kuang X, Crock B, and Skelton A. Media campaigns to promote smoking cessation among socioeconomically disadvantaged populations: What do we know, what do we need to learn, and what should we do now? Social Science & Medicine, 2008; 67(9):1343–55. Available from: http://www.ncbi.nlm.nih.gov/pubmed/18691793
32. Durkin SJ, Brennan E, and Wakefield MA. Optimising tobacco control campaigns within a changing media landscape and among priority populations. Tobacco Control, 2022; 31(2):284-90. Available from: https://tobaccocontrol.bmj.com/content/tobaccocontrol/31/2/284.full.pdf
33. Hill D. Public response to the quit campaign household survey, in Quit evaluation studies no. 1. Hill D, Editor Melbourne: Victorian Smoking and Health Project, Anti-Cancer Council of Victoria; 1986. p 11–32.
34. Mullins R, Morand M, and Borland R. Key findings of the 1994 and 1995 household survey, in Quit evaluation studies no. 8, 1994-1995. Melbourne: Victorian Smoking and Health Program; 1996. p 1–23 Available from: http://www.quit.org.au/downloads/QE/QE8/Home.html.
35. Centre for Behavioural Research in Cancer, Quit evaluation studies. Melbourne: Victorian Smoking and Health Program; 1985 to 2001. Available from: http://www.quit.org.au/browse.asp?ContainerID=1755.
36. Donovan RJ, Boulter J, Borland R, Jalleh G, and Carter O. Continuous tracking of the Australian national tobacco campaign: Advertising effects on recall, recognition, cognitions, and behaviour. Tobacco Control, 2003; 12 Suppl 2(suppl. 2):ii30–9. Available from: https://www.ncbi.nlm.nih.gov/pubmed/12878771
37. Wakefield M, Freeman J, and Boulter J. Changes associated with the national tobacco campaign: Pre and post campaign surveys compared, in Australia's national tobacco campaign: Evaluation report vol. 1. Hassard K, Editor Canberra: Commonwealth Department of Health and Aged Care; 1999. Available from: http://www.health.gov.au/internet/wcms/Publishing.nsf/Content/health-pubhlth-publicat-document-metadata-tobccamp.htm.
38. Siahpush M, Wakefield M, Spittal M, and Durkin S. Antismoking television advertising and socioeconomic variations in calls to quitline. Journal of Epidemiology and Community Health, 2007; 61(4):298–301. Available from: https://www.ncbi.nlm.nih.gov/pubmed/17372288
39. Siahpush M and Borland R. Trends in sociodemographic variations in smoking prevalence, 1997-2000, in Australia's national tobacco campaign: Evaluation report vol. 3 every cigarette is doing you damage. Research Evaluation Committee, Editor Canberra: Commonwealth Department of Health and Aged Care; 2004. Available from: https://webarchive.nla.gov.au/awa/20140801053454/http://www.health.gov.au/internet/main/publishing.nsf/Content/health-pubhlth-publicat-document-tobccamp_3-cnt.
40. Cooper J and Borland R. Responses to fifth wave of the international tobacco control four-country survey, by educational attainment and income adjusted for household size, unpublished data, Michelle Scollo of the Tobacco Control Unit, Editor 2008, Knowledge Building Team, The Cancer Council Victoria: Melbourne.
41. Wakefield MA, Loken B, and Hornik RC. Use of mass media campaigns to change health behaviour. The Lancet, 2010; 376(9748):1261–71. Available from: http://dx.doi.org/10.1016/S0140-6736(10)60809-4
42. Watt J. Overview, in Quit evaluation studies no. 9. Trotter L and Mullins R, Editors. Melbourne: Centre for Behavioural Research in Cancer, Anti-Cancer Council of Victoria; 1998.
43. Hill D, Borland R, Carrol T, Donovan R, and Taylor J. Perspectives of the Australian national tobacco campaign, in Australia's national tobacco campaign, evaluation volume two. Hassard K, Editor Canberra: Commonwealth Department of Health and Aged Care; 2000. p 1–9 Available from: http://www.health.gov.au/internet/main/publishing.nsf/Content/health-pubhlth-publicat-document-tobccamp_2-cnt.htm.
44. Hill D and Alcock J. Background to campaign, in Australia's national tobacco campaign: Evaluation report volume one. Hassard K, Editor Canberra: Commonwealth Department of Health and Aged Care; 1999. Available from: http://www.health.gov.au/internet/main/publishing.nsf/Content/health-pubhlth-publicat-document-metadata-tobccamp.htm.
45. Alcock J. Background to the campaign in 1998, in Australia's national tobacco campaign. Evaluation report volume two. Canberra: Commonwealth Department of Health and Aged Care; 2000. p 11–20 Available from: http://www.health.gov.au/internet/main/publishing.nsf/Content/health-pubhlth-publicat-document-tobccamp_2-cnt.htm.
46. Erbas B, Bui Q, Huggins R, Harper T, and White V. Investigating the relation between placement of quit antismoking advertisements and number of telephone calls to quitline: A semiparametric modelling approach. Tobacco Control, 2006; 15(2):74. Available from: http://tc.bmjjournals.com
47. Carroll T and Rock B. Generating quitline calls during Australia's national tobacco campaign: Effects of television advertisement execution and programme placement. Tobacco Control, 2003; 12 Suppl 2(suppl 2):ii40–4. Available from: https://www.ncbi.nlm.nih.gov/pubmed/12878772
48. Bain E, Durkin S, and Wakefield M. Smoking prevalence and consumption in Victoria: Key findings from the 1998–2012 population surveys. CBRC Research Paper Series, No. 45 Centre for Behavioural Research in Cancer, Melbourne: Cancer Council Victoria, 2013. Available from: http://www.cancervic.org.au/downloads/cbrc_research_papers/RPS45.pdf.
49. Durkin S, Wakefield M, and Spittal M. Which types of televised anti-tobacco campaigns prompt more quitline calls from disadvantaged groups? Health Education Research, 2011; 26(6):998–1009. Available from: http://her.oxfordjournals.org/content/26/6/998.abstract
50. Durkin SJ, Biener L, and Wakefield MA. Effects of different types of antismoking ads on reducing disparities in smoking cessation among socioeconomic subgroups. American Journal of Public Health, 2009; 99(12):2217–23. Available from: https://www.ncbi.nlm.nih.gov/pubmed/19833980
51. Durkin S, Bayly M, Brennan E, Biener L, and Wakefield M. Fear, sadness and hope: Which emotions maximize impact of anti-tobacco mass media advertisements among lower and higher SES groups? Journal of Health Communication, 2018; 23(5):445–61. Available from: https://www.ncbi.nlm.nih.gov/pubmed/29702038
52. Durkin SJ, Schoenaker D, Brennan E, Bayly M, and Wakefield MA. Are anti-smoking social norms associated with tobacco control mass media campaigns, tax and policy changes? Findings from an Australian serial cross-sectional population study of smokers. Tobacco Control, 2021; 30(2):177–84. Available from: https://www.ncbi.nlm.nih.gov/pubmed/32269172
53. Townsend J, Roderick P, and Cooper J. Cigarette smoking by socioeconomic group, sex, and age: Effects of price, income, and health publicity. British Medical Journal, 1994; 309(6959):923–7. Available from: https://www.ncbi.nlm.nih.gov/pubmed/7950662
54. Farrelly M and Bray J. Response to increases in cigarette prices by race/ethnicity, income, and age groups—United States, 1976-1993. Morbidity and Mortality Weekly Report, 1998; 47(29):605–9. Available from: http://www.cdc.gov/mmwr/preview/mmwrhtml/00054047.htm
55. Farrelly M, Bray J, Pechacek T, and Woollery T. Response by adults to increases in cigarette prices by sociodemographic characteristics. Southern Economic Journal, 2001; 68(1):156–65. Available from: http://findarticles.com/p/articles/mi_qa5421/is_200107/ai_n21475043
56. Levy DT, Mumford EA, and Compton C. Tobacco control policies and smoking in a population of low education women, 1992-2002. Journal of Epidemiology and Community Health, 2006; 60 Suppl 2(60):20–6. Available from: https://www.ncbi.nlm.nih.gov/pubmed/17708007
57. Thomas S, Fayter D, Misso K, Ogilvie D, Petticrew M, et al. Population tobacco control interventions and their effects on social inequalities in smoking: Systematic review. Tobacco Control, 2008; 17(4):230–7. Available from: https://www.ncbi.nlm.nih.gov/pubmed/18426867
58. Licht AS, Hyland AJ, O'Connor RJ, Chaloupka FJ, Borland R, et al. Socio-economic variation in price minimizing behaviors: Findings from the international tobacco control (ITC) four country survey. International Journal of Environmental Research and Public Health, 2011; 8(1):234–52. Available from: https://www.ncbi.nlm.nih.gov/pubmed/21318026
59. Dunlop SM, Perez D, and Cotter T. Australian smokers' and recent quitters' responses to the increasing price of cigarettes in the context of a tobacco tax increase. Addiction, 2011; 106(9):1687–95. Available from: https://www.ncbi.nlm.nih.gov/pubmed/21561498
60. Keeler C, Wang Y, Max W, Yao T, Gu D, et al. The association of california's proposition 56 tobacco tax increase with smoking behavior across racial and ethnic groups and by income. Nicotine & Tobacco Research, 2021; 23(12):2091–101. Available from: https://www.ncbi.nlm.nih.gov/pubmed/34137859
61. Serrano-Alarcon M, Kunst AE, Bosdriesz JR, and Perelman J. Tobacco control policies and smoking among older adults: A longitudinal analysis of 10 European countries. Addiction, 2019; 114(6):1076–85. Available from: https://www.ncbi.nlm.nih.gov/pubmed/30868688
62. Vladisavljevic M, Zubovic J, Dukic M, and Jovanovic O. Inequality-reducing effects of tobacco tax increase: Accounting for behavioral response of low-, middle-, and high-income households in serbia. International Journal of Environmental Research and Public Health, 2021; 18(18). Available from: https://www.ncbi.nlm.nih.gov/pubmed/34574420
63. Lim HK and Khang YH. Tobacco price increases in Korea and their impact on socioeconomic inequalities in smoking and subsequent socioeconomic inequalities in mortality: A modelling study. Tobacco Control, 2020. Available from: https://www.ncbi.nlm.nih.gov/pubmed/32220983
64. Bader P, Boisclair D, and Ferrence R. Effects of tobacco taxation and pricing on smoking behavior in high risk populations: A knowledge synthesis. International Journal of Environmental Research and Public Health, 2011; 8(11):4118–39. Available from: https://www.ncbi.nlm.nih.gov/pubmed/22163198
65. International Agency for Research on Cancer. Effectiveness of tax and price policies for tobacco control. Handbooks of Cancer Prevention, Vol.14.Lyon, France: IARC, 2011. Available from: http://www.iarc.fr/en/publications/list/handbooks/.
66. World Health Organization. Who report on the global tobacco epidemic: Raising taxes on tobacco. Geneva: WHO, 2015. Available from: http://www.who.int/tobacco/global_report/2015/en/index.html.
67. Fuchs A, Márquez PV, Dutta S, and Icaza FG. Is tobacco taxation regressive? Policy note. Washington DC: Worl Bank Group, 2019. Available from: http://documents.worldbank.org/curated/en/893811554737147697/Is-Tobacco-Taxation-Regressive-Evidence-on-Public-Health-Domestic-Resource-Mobilization-and-Equity-Improvements.
68. Scollo M, Younie S, Wakefield M, Freeman J, and Icasiano F. Impact of tobacco tax reforms on tobacco prices and tobacco use in Australia. Tobacco Control, 2003; 12(suppl. 2):ii59–ii66. Available from: http://tc.bmjjournals.com/cgi/content/abstract/12/suppl_2/ii59
69. Siahpush M, Wakefield MA, Spittal MJ, Durkin SJ, and Scollo MM. Taxation reduces social disparities in adult smoking prevalence. American Journal of Preventive Medicine, 2009; 36(4):285–91. Available from: https://www.ncbi.nlm.nih.gov/pubmed/19201146
70. Wilkinson AL, Scollo MM, Wakefield MA, Spittal MJ, Chaloupka FJ, et al. Smoking prevalence following tobacco tax increases in Australia between 2001 and 2017: An interrupted time-series analysis. The Lancet Public Health, 2019; 4(12):e618–e27. Available from: https://doi.org/10.1016/S2468-2667(19)30203-8
71. The International Agency for Research on Cancer, Effectiveness of tax and price policies for tobacco control. Handbooks of cancer prevention, tobacco control Vol. 14.Lyon, France: IARC; 2011.
72. International Agency for Research on Cancer. Evaluating the effectiveness of smoke-free policies. Handbooks of Cancer Prevention, Tobacco Control, vol. 13.Lyon, France: IARC, 2009. Available from: http://www.iarc.fr/en/publications/pdfs-online/prev/handbook13/index.php.
73. Frazer K, Callinan JE, McHugh J, van Baarsel S, Clarke A, et al. Legislative smoking bans for reducing harms from secondhand smoke exposure, smoking prevalence and tobacco consumption. Cochrane Database of Systematic Reviews, 2016; 2:CD005992. Available from: https://www.ncbi.nlm.nih.gov/pubmed/26842828
74. Stallings-Smith S, Goodman P, Kabir Z, Clancy L, and Zeka A. Socioeconomic differentials in the immediate mortality effects of the national Irish smoking ban. PLoS One, 2014; 9(6):e98617. Available from: https://www.ncbi.nlm.nih.gov/pubmed/24887027
75. Sandoval JL, Leao T, Cullati S, Theler JM, Joost S, et al. Public smoking ban and socioeconomic inequalities in smoking prevalence and cessation: A cross-sectional population-based study in Geneva, Switzerland (1995-2014). Tobacco Control, 2018; 27(6):663–9. Available from: https://www.ncbi.nlm.nih.gov/pubmed/29374093
76. Nagelhout GE, Willemsen MC, and de Vries H. The population impact of smoke-free workplace and hospitality industry legislation on smoking behaviour. Findings from a national population survey. Addiction, 2011; 106(4):816–23. Available from: https://www.ncbi.nlm.nih.gov/pubmed/21182553
77. Mayne SL, Auchincloss AH, Tabb LP, Stehr M, Shikany JM, et al. Associations of bar and restaurant smoking bans with smoking behavior in the cardia study: A 25-year study. American Journal of Epidemiology, 2018; 187(6):1250–8. Available from: https://www.ncbi.nlm.nih.gov/pubmed/29860468
78. Leon-Gomez BB, Colell E, Villalbi JR, Barrio G, and Domingo-Salvany A. Impact of smoke-free regulations on smoking prevalence trends in spain. European Journal of Public Health, 2017; 27(1):123–8. Available from: https://www.ncbi.nlm.nih.gov/pubmed/28177493
79. Dutra LM, Farrelly MC, Nonnemaker J, Bradfield B, Gaber J, et al. Differential relationship between tobacco control policies and u.S. Adult current smoking by poverty. International Journal of Environmental Research and Public Health, 2019; 16(21). Available from: https://www.ncbi.nlm.nih.gov/pubmed/31717748
80. Tchicaya A, Lorentz N, and Demarest S. Socioeconomic inequalities in smoking and smoking cessation due to a smoking ban: General population-based cross-sectional study in Luxembourg. PLoS One, 2016; 11(4):e0153966. Available from: https://www.ncbi.nlm.nih.gov/pubmed/27100293
81. Hawkins SS, Cole TJ, and Law C. Examining smoking behaviours among parents from the UK millennium cohort study after the smoke-free legislation in Scotland. Tobacco Control, 2011; 20(2):112–8. Available from: https://www.ncbi.nlm.nih.gov/pubmed/21076118
82. Cesaroni G, Forastiere F, Agabiti N, Valente P, Zuccaro P, et al. Effect of the Italian smoking ban on population rates of acute coronary events. Circulation, 2008; 117(9):1183–8. Available from: https://www.ncbi.nlm.nih.gov/pubmed/18268149
83. McCarthy M, Durkin S, Brennan E, and Germain D. Smokefree hospitality venues in Victoria: Public approval, patronage and quitting behaviour, 2004–2007. CBRC Research Paper Series no. 32, Melbourne, Australia: Centre for Behavioural Research in Cancer, Cancer Council Victoria, 2008. Available from: http://www.cancervic.org.au/downloads/cbrc_research_papers/CBRC_res_paper_smokefree_ven32-08.pdf.
84. Gorini G, Carreras G, Cortini B, Verdi S, Petronio MG, et al. Impact of national smoke-free legislation on educational disparities in smoke-free homes: Findings from the sidriat longitudinal study. International Journal of Environmental Research and Public Health, 2015; 12(8):8705–16. Available from: https://www.ncbi.nlm.nih.gov/pubmed/26213956
85. Robson M, Lord J, and Doran T. Estimating the equity impacts of the smoking ban in England on cotinine levels: A regression discontinuity design. BMJ Open, 2021; 11(9):e049547. Available from: https://www.ncbi.nlm.nih.gov/pubmed/34548357
86. Daley A, Rahman M, and Watson B. Racial/ethnic differences in light of 100% smoke-free state laws: Evidence from adults in the United States. Popul Health Manag, 2021; 24(3):353–9. Available from: https://www.ncbi.nlm.nih.gov/pubmed/32639185
87. Dinno A and Glantz S. Tobacco control policies are egalitarian: A vulnerabilities perspective on clean indoor air laws, cigarette prices, and tobacco use disparities. Social Science and Medicine, 2009; 68(8):1439–47. Available from: http://www.ncbi.nlm.nih.gov/pubmed/19282078
88. Dahne J, Wahlquist AE, Garrett-Mayer E, Heckman BW, Michael Cummings K, et al. The differential impact of state tobacco control policies on cessation treatment utilization across established tobacco disparities groups. Preventive Medicine, 2017; 105:319–25. Available from: https://www.ncbi.nlm.nih.gov/pubmed/28987337
89. Hafez AY, Gonzalez M, Kulik MC, Vijayaraghavan M, and Glantz SA. Uneven access to smoke-free laws and policies and its effect on health equity in the United States: 2000-2019. American Journal of Public Health, 2019; 109(11):1568–75. Available from: https://www.ncbi.nlm.nih.gov/pubmed/31536405
90. Ferketich AK, Lugo A, La Vecchia C, Fernandez E, Boffetta P, et al. Relation between national-level tobacco control policies and individual-level voluntary home smoking bans in Europe. Tobacco Control, 2016; 25(1):60–5. Available from: https://www.ncbi.nlm.nih.gov/pubmed/25335901
91. Hollar TL, Cook N, Quinn D, Phillips T, and DeLucca M. Smoke-free multi-unit housing policies show promise in reducing secondhand smoke exposure among racially and ethnically diverse, low-income seniors. Journal of Immigrant and Minority Health, 2017; 19(6):1281–9. Available from: https://www.ncbi.nlm.nih.gov/pubmed/27189486
92. Gibson L, Brennan E, Momjian A, Shapiro-Luft D, Seitz H, et al. Assessing the consequences of implementing graphic warning labels on cigarette packs for tobacco-related health disparities. Nicotine & Tobacco Research, 2015; 17(8):898–907. Available from: https://www.ncbi.nlm.nih.gov/pubmed/26180214
93. Guillaumier A, Bonevski B, Paul C, Durkin S, and D'Este C. Socioeconomically disadvantaged smokers' ratings of plain and branded cigarette packaging: An experimental study. BMJ Open, 2014; 4(2):e004078. Available from: https://www.ncbi.nlm.nih.gov/pubmed/24503299
94. Maddox R, Durkin S, and Lovett R. Plain packaging implementation: Perceptions of risk and prestige of cigarette brands among Aboriginal and Torres Strait Islander people. Australian and New Zealand Journal of Public Health, 2016; 40(3):221–5. Available from: https://www.ncbi.nlm.nih.gov/pubmed/26713418
95. Dunlop S, Freeman B, and Perez D. Exposure to internet-based tobacco advertising and branding: Results from population surveys of Australian youth 2010-2013. Journal of Medical Internet Research, 2016; 18(6):e104. Available from: https://www.ncbi.nlm.nih.gov/pubmed/27338761
96. Moran MB, Heley K, Pierce JP, Niaura R, Strong D, et al. Ethnic and socioeconomic disparities in recalled exposure to and self-reported impact of tobacco marketing and promotions. Health Commun, 2019; 34(3):280–9. Available from: https://www.ncbi.nlm.nih.gov/pubmed/29236530
97. Beleva Y, Pike JR, Miller S, Xie B, Ames SL, et al. Share of advertising voice at the point-of-sale and its influence on at-risk students' use of alternative tobacco products. Nicotine & Tobacco Research, 2019; 21(7):903–10. Available from: https://www.ncbi.nlm.nih.gov/pubmed/30032290
98. Ribisl KM, Golden SD, Huang J, and Scollo M. Addressing lower-priced cigarette products through three-pronged comprehensive regulation on excise taxes, minimum price policies and restrictions on price promotions. Tobacco Control, 2022; 31(2):229–34. Available from: https://www.ncbi.nlm.nih.gov/pubmed/35241593
99. Bayly M, Scollo M, White S, Lindorff K, and Wakefield M. Tobacco price boards as a promotional strategy-a longitudinal observational study in Australian retailers. Tobacco Control, 2018; 27(4):427–33. Available from: https://www.ncbi.nlm.nih.gov/pubmed/28735275
100. Paynter J and Edwards R. The impact of tobacco promotion at the point of sale: A systematic review. Nicotine & Tobacco Research, 2009; 11(1):25–35. Available from: http://ntr.oxfordjournals.org/cgi/content/abstract/11/1/25
101. Robertson L, McGee R, Marsh L, and Hoek J. A systematic review on the impact of point-of-sale tobacco promotion on smoking. Nicotine & Tobacco Research, 2015; 17(1):2–17. Available from: https://www.ncbi.nlm.nih.gov/pubmed/25173775
102. Robertson L, Cameron C, McGee R, Marsh L, and Hoek J. Point-of-sale tobacco promotion and youth smoking: A meta-analysis. Tobacco Control, 2016; 25(e2):e83–e9. Available from: https://www.ncbi.nlm.nih.gov/pubmed/26728139
103. Dalglish E, McLaughlin D, Dobson A, and Gartner C. Cigarette availability and price in low and high socioeconomic areas. Australian and New Zealand Journal of Public Health, 2013; 37(4):371–6. Available from: https://www.ncbi.nlm.nih.gov/pubmed/23895481
104. Wood LJ, Pereira G, Middleton N, and Foster S. Socioeconomic area disparities in tobacco retail outlet density: A Western Australian analysis. Medical Journal of Australia, 2013; 198(9):489–91. Available from: https://www.ncbi.nlm.nih.gov/pubmed/23682892
105. Fry R, Burton S, Williams K, Walsberger S, Tang A, et al. Retailer licensing and tobacco display compliance: Are some retailers more likely to flout regulations? Tobacco Control, 2017; 26(2):181–7. Available from: https://www.ncbi.nlm.nih.gov/pubmed/27060100
106. US Department of Health and Human Services. Efforts to prevent tobacco use among young people: Review of the effectiveness of mass media campaigns, in Preventing tobacco use among youth and young adults: A report of the Surgeon General. Atlanta, Georgia: US Department of Health and Human Services, Public Health Service, Centers for Disease Control and Prevention, National Center for Chronic Disease Prevention and Health Promotion, Office on Smoking and Health; 2012. Available from: http://www.cdc.gov/tobacco/data_statistics/sgr/2012/index.htm.
107. Brennan E, Jeong M, Kybert-Momjian A, and Hornik RC. Preventing and reducing tobacco use among youth and young adults: A systematic review of the effectiveness of mass media interventions, 2008-2013. Philadelphia, PA: Annenberg School for Communication, University of Pennsylvania, 2016. Available from: http://repository.upenn.edu/asc_papers/471/.
108. Carson KV, Ameer F, Sayehmiri K, Hnin K, van Agteren JE, et al. Mass media interventions for preventing smoking in young people. Cochrane Database of Systematic Reviews, 2017; 6:CD001006. Available from: https://www.ncbi.nlm.nih.gov/pubmed/28574573
109. Allen JA, Duke JC, Davis KC, Kim AE, Nonnemaker JM, et al. Using mass media campaigns to reduce youth tobacco use: A review. American Journal of Health Promotion, 2015; 30(2):e71–82. Available from: https://www.ncbi.nlm.nih.gov/pubmed/25372236
110. Colston DC, Xie Y, Thrasher JF, Patrick ME, Titus AR, et al. Examining truth and state-sponsored media campaigns as a means of decreasing youth smoking and related disparities in the United States. Nicotine & Tobacco Research, 2022; 24(4):469–77. Available from: https://www.ncbi.nlm.nih.gov/pubmed/34718762
111. Pfortner TK, Hublet A, Schnohr CW, Rathmann K, Moor I, et al. Socioeconomic inequalities in the impact of tobacco control policies on adolescent smoking. A multilevel study in 29 European countries. Addictive Behaviors, 2016; 53:58–66. Available from: https://www.ncbi.nlm.nih.gov/pubmed/26454551
112. Kuipers MAG, Monshouwer K, van Laar M, and Kunst AE. Tobacco control and socioeconomic inequalities in adolescent smoking in Europe. American Journal of Preventive Medicine, 2015; 49(5):e64–e72. Available from: https://www.ncbi.nlm.nih.gov/pubmed/26164833
113. White VM, Hayman J, and Hill DJ. Can population-based tobacco-control policies change smoking behaviors of adolescents from all socio-economic groups? Findings from Australia: 1987-2005. Cancer Causes Control, 2008; 19(6):631–40. Available from: https://www.ncbi.nlm.nih.gov/pubmed/18264783
114. Colston DC, Titus AR, Thrasher JF, Elliott MR, and Fleischer NL. Area-level predictors of tobacco 21 coverage in the u.S. Before the national law: Exploring potential disparities. American Journal of Preventive Medicine, 2021; 60(1):29–37. Available from: https://www.ncbi.nlm.nih.gov/pubmed/33160795
115. Roberts ME, Klein EG, Ferketich AK, Keller-Hamilton B, Berman ML, et al. Beyond strong enforcement: Understanding the factors related to retailer compliance with tobacco 21. Nicotine & Tobacco Research, 2021; 23(12):2084–90. Available from: https://www.ncbi.nlm.nih.gov/pubmed/33982115
116. Papanastasiou N, Hill S, and Amos A. Evidence from qualitative studies of youth about the impacts of tobacco control policy on young people in Europe: A systematic review. Nicotine & Tobacco Research, 2019; 21(7):863–70. Available from: https://www.ncbi.nlm.nih.gov/pubmed/29370431
117. Skinner WF, Massey JL, Krohn MD, and Lauer RM. Social influences and constraints on the initiation and cessation of adolescent tobacco use. Journal of Behavioral Medicine 1985; 8(4):353–76. Available from: http://www.springerlink.com/content/wn216211228267gr/
118. Foshee V and Bauman K. Parental attachment and adolescent smoking initiation. Journal of Adolescent Research, 1994; 9:88–104. Available from: https://journals.sagepub.com/doi/10.1177/074355489491007
119. Resnick MD, Bearman PS, Blum RW, Bauman KE, Harris KM, et al. Protecting adolescents from harm. Findings from the national longitudinal study on adolescent health. Journal of the American Medical Association, 1997; 278(10):823–32. Available from: https://www.ncbi.nlm.nih.gov/pubmed/9293990
120. Zubrick S, Silburn S, Gurrin L, Teoh H, Shepherd C, et al. Western Australian child health survey: Education, health and competence. Perth, Western Australia: Australian Bureau of Statistics and the TVW Telethon Institute for Child Health Research, 1997. Available from: http://trove.nla.gov.au/work/153144358?q&versionId=217785299.
121. Zubrick S and Silburn S, Education, health and competence. Western Australian child health survey: Education and competence. 1997.
122. Zubrick S, Lawrence D, Silburn S, Blair E, Milroy H, et al. The Western Australian child health survey: The health of Aboriginal children and young people. Telethon Institute of Child Health Research, 2004. Available from: www.ichr.uwa.edu.au.
123. Bryant AL, Schulenberg J, Bachman JG, Malley PM, and Johnston LD. Understanding the links among school misbehavior, academic achievement, and cigarette use: A national panel study of adolescents. Prevention Science, 2000; 1:71–87. Available from: http://www.ingentaconnect.com/content/klu/prev/2000/00000001/00000002/00223014
124. White VM, Hayman J, and Szabo E. Social support, school involvement, unsupervised recreation and adolescent substance use among Victorian secondary school students in 2005, in Victorian secondary school students' use of licit and illicit substances in 2005. Results from the 2005 Australian secondary students' alcohol and drug survey. Melbourne: Victorian Department of Human Services; 2006. Available from: http://www.health.vic.gov.au/drugservices/pubs/vsss_2005.htm.
125. Lepage B, Colineaux H, Kelly-Irving M, Vineis P, Delpierre C, et al. Comparison of smoking reduction with improvement of social conditions in early life: Simulation in a British cohort. Int J Epidemiol, 2021; 50(3):797–808. Available from: https://www.ncbi.nlm.nih.gov/pubmed/33349858
126. Patterson JM, Eberly LE, Ding Y, and Hargreaves M. Associations of smoking prevalence with individual and area level social cohesion. Journal of Epidemiology and Community Health, 2004; 58(8):692–7. Available from: https://www.ncbi.nlm.nih.gov/pubmed/15252073
127. Kawatchi I, Kennedy B, and Glass R. Social capital and self-rated health: A contextual analysis. American Journal of Public Health, 1999; 89(8):1187–93. Available from: http://www.ajph.org/cgi/reprint/89/8/1187
128. Miles R. Neighborhood disorder and smoking: Findings of a European urban survey. Social Science & Medicine, 2006; 63(9):2464–75. Available from: https://www.ncbi.nlm.nih.gov/pubmed/16904800
129. Xue Y, Zimmerman MA, and Caldwell CH. Neighborhood residence and cigarette smoking among urban youths: The protective role of prosocial activities. American Journal of Public Health, 2007. Available from: http://www.ajph.org/cgi/content/abstract/AJPH.2005.081307v1