1.3.1 Latest estimates of smoking prevalence in Australia
The most recent available data on prevalence of smoking in Australia can be found in the reports of the 2022–23 National Drug Strategy Household Survey published by the Australian Institute of Health and Welfare1 and of the 2022 National Health Survey, published by the Australian Bureau of Statistics.2
National Drug Strategy Household Survey
The National Drug Strategy Household Survey most commonly refers to daily smoking rates among those 14 years and over. However, also included are figures for those 18 years and over who are daily or current smokers. These figures are reproduced in Table 1.3.1.
In shorthand speech, the ‘prevalence of smoking among adults in Australia’ could be cited simply as 11.1% (the rate of current smoking for adults 18 years and older).
National Health Survey
According to the Australian Bureau of Statistics’ National Health Survey, the prevalence of daily smoking for Australians aged 18 and over in 2022 was 10.6%, and 10.2% among people aged 15 years and over.2
1.3.2 Historical trends in smoking prevalence in Australia
Measurements of the prevalence of smoking in Australia first became available in 1945. Limited survey data3 are available for the years between then and 1974, when the Anti-Cancer Council of Victoria (now Cancer Council Victoria) conducted its first national survey.4 , 5 These early data show that in around the middle of the last century, a clear majority of males aged 16 and over were smokers, compared to about one-quarter of females (Table 1.3.2). In the following decades smoking among men declined, probably in response to the initial publicity regarding the health effects of smoking, which first emerged in the 1950s and early 1960s.6-9 Women have always had a lower prevalence of smoking than men, but smoking among women continued to increase in the 1970s.
The findings of the early studies from Cancer Council Victoria are broadly confirmed by those of a survey by the Australian Bureau of Statistics undertaken in 1977, which found that 36% of the adult population (aged 18 and over) were smokers: 43% of men and 29% of women.10
Table 1.3. 3 shows the proportion of smokers in the population aged 18 and over from 1980 to 1998. Taking into account the ageing of the population and other demographic trends over that period by standardising this data to the 2001 population structure, the prevalence of smoking declined for both sexes over this period, the most dramatic drop occurring among males between 1983 and 1986, when prevalence decreased relatively by 15%. The differential in smoking rates between the sexes also continued to close (while remaining statistically significant across the years to 1998), largely due to greater numbers of men quitting smoking during the mid-to-late 1980s. However, the overall rate of decline seen during the 1980s did not continue into the 1990s, where the prevalence of smoking levelled at about 27%.
After this relatively static period in the 1990s, the decline resumed for both genders after 2001. Between 2019 and 2022–23, there was a significant decline in current smoking for both genders and the total population (see Table 1.3.4).
Hill and colleagues have suggested that the pattern of decline in smoking prevalence correlates with the level of tobacco control activities occurring at the time.11 , 12 The drop in male smoking rates seen in the early 1980s coincided with a period of new, well-funded media-led Quit campaigns11 and an upsurge in debate about tobacco control issues in the media, fuelled by the outspoken campaigning of groups such as the Australian Council on Smoking and Health and Action on Smoking and Health, and the widely publicised activities of the fringe groups MOP UP and BUGA UP. i Conversely, the steady prevalence rates in both sexes seen during the 1990s correspond with a lull in legislative activity concerning tobacco advertising and smoking restrictions, and also with a sharp reduction in per capita expenditure on public education campaigns.11
The subsequent downturn in smoking prevalence seen by the end of the 1990s—see Figure 1.3.1—may be attributable to the combined effects of increased tobacco taxes,13 additional smokefree legislation, and the National Tobacco Campaign, a mass-media led program aimed at encouraging cessation, which was launched in June 199714 and ran over several subsequent years.15 , 16 (See also Chapter 10.) Throughout the 2010s, further declines in smoking prevalence occurred in the wake of large tobacco excise increases, plain packaging, and increasingly comprehensive smoking bans (see Figure A1.6 and Section 15.7).
Figure 1.3.1 Prevalence of current * smokers † in Australia aged 18+ years, for all Australians and by gender— 1980 to 2022–23 ‡ (%)
Data from the ABS show that in 2001, the proportion of adults who were daily smokers was 22.3%.17 In 2022, the daily smoking rate among Australian adults had more than halved and was 10.6%—see Figure 1.3.2. 2
Figure 1.3.2 Proportion of Australians 18+ who smoke daily—2001 to 2022
Another long-running source of information about the prevalence of smoking is the Single Source Survey established in 1974 by the Roy Morgan Research Company. Door-to-door interviews conducted each week throughout Australia generate data from over 50,000 survey respondents each year.
Cancer Council Victoria analysis of monthly data from this survey from the largest five-capital cities over the 15 years to August 2017 shows a continuing decline in smoking since mid-2006—see Figure 1.3.3.
Figure 1.3.3 Proportions of Australians 18+ living in largest five capital cities who report being current smokers—12-month rolling average, January 2001 to August 2017
Smoking remains a leading cause of death and disease in Australia; in 2018, tobacco use was the cause of 20,482 deaths (13%, or more than one in every eight).18 Since about one in six men and about one in eight women still smoke,19 and given that two–thirds of these smokers can be expected to die because of their tobacco use if they do not quit,20 the sequelae of tobacco-caused death and disease will remain for decades to come. Mortality caused by tobacco use is discussed in Chapter 3.
1.3.3 International comparisons of adult smoking prevalence
In 2019, an estimated 19.6% of the global population were smokers; approximately 940 million males and 193 million females ages 15 or older worldwide were. In general, the prevalence of smoking is declining across all regions/continents, though, prevalence is increasing in some countries, mostly in Africa. Despite declines in smoking prevalence, the majority of smoking-related deaths occur in countries with high and very high development due to decades-long delay between changes in smoking prevalence and changes in smoking-related mortality rates.21 As global patterns in tobacco use change, the burden of death can be expected to shift dramatically from the developed world to less wealthy countries.22 This is at least in part due to a lack of adequate tobacco controls.23
A paradigm illustrating the typical progression of tobacco use worldwide, first proposed by Lopez and colleagues24 and later adapted by the WHO,25 is reproduced in Figure 1.3.4. Many (but not all) countries’ experiences of patterns of tobacco use fit this model.
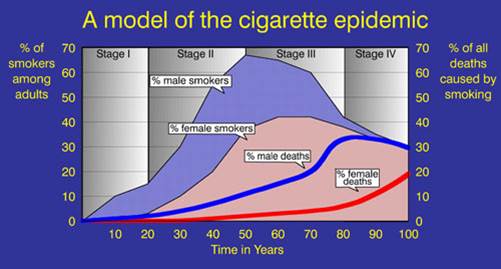
Figure 1.3.4 Four stages of the tobacco epidemic
Stage I of the model is marked by a low smoking prevalence (below 20%), generally limited to males and accompanied by little evident increase in tobacco-caused chronic illness. Countries at stage I have not yet become major consumers in the global tobacco economy, but represent untapped potential for the tobacco industry. Some countries in sub-Saharan Africa fit into this stage in the model.25 The importance of tobacco farming in some countries in the region (e.g. Zimbabwe and Malawi) may act as a deterrent to the introduction of tobacco control policies. Zimbabwe is among the largest producers of tobacco in the world and is a major exporter; concerns about the health consequences of tobacco use are not high on the national agenda.26
In stage II of the paradigm, male prevalence of smoking increases to more than 50% in men, and women’s smoking rates also begin increasing. Uptake of smoking occurs at an earlier age, and, although there is evidence of increased lung cancer and other chronic illness due to smoking among men, public and political understanding of and support for tobacco control initiatives is still not widespread. Countries that fit into this transitional stage include Japan, some nations within the Southeast Asian, Latin American and North African regions, and to a lesser extent, China (the case of China is discussed further below).25
Stage III of the epidemic has been reached when smoking prevalence peaks and begins to decline in both sexes, although deaths caused by smoking continue to increase because of earlier high smoking rates. Health education programs are better developed, and smoking becomes less accepted among the more educated groups of society. Smoking becomes less socially acceptable and the climate is increasingly conducive to the introduction of tobacco control policies. Certain countries within Eastern and Southern Europe and Latin America are at this point on the continuum.25
Evolution into stage IV is marked by a continued distinct but gradual downturn in smoking prevalence among both males and females. Male deaths from smoking begin to decline, but female death rates continue to rise, reflecting earlier smoking patterns. Parts of Western Europe, the UK, the US, Canada, New Zealand and Australia are at various points on the continuum in the fourth stage of the tobacco epidemic.25 However, comprehensive and continually monitored public health strategies remain critical to maintain and reinforce declines in smoking prevalence.25
As noted above, there are some countries for which the paradigm devised by Lopez and colleagues in Figure 1.3.1 does not fit. This is especially so in nations in which female smoking rates have not shown a pattern of steady increase in stage II, despite high prevalence among males, most likely due to social or cultural constraints. For example, men in China and Indonesia have maintained high rates of smoking for many years, while female prevalence has remained in single digits. Nevertheless the WHO model described above does provide a useful framework into which many countries can be placed, and may enable countries currently at an earlier stage in the paradigm to recognise their situation, learn from international experience and introduce strong public health measures that will reduce the impact of tobacco on their population. Singapore provides a successful example of early intervention. In the early 1970s, while at stage II of the model, the Singaporean government initiated a series of tobacco control measures which capped smoking prevalence at a relatively low level, effectively averting the later stages of the epidemic. Thousands of tobacco-caused deaths in Singapore have been prevented as a result of this early, decisive action.24
Figure 1.3.5 and Figure 1.3.6 show prevalence data collected by the Organisation for Economic Co-operation and Development (OECD) of its member countries.27 The Tobacco Atlas published by the American Cancer Society and World Lung Foundation, and the Global Health Observatory published by the World Health Organization, have both compiled data on the prevalence of smoking in almost all other countries worldwide—see here and here.28 , 29 The figures below are provided in order to give a general global overview. It is important to note that data sets between countries are not directly comparable, due to differences in sampling (most crucially the year of the survey). Further, studies which only take into account the smoking of manufactured cigarettes will underestimate tobacco use in countries where tobacco is widely used in other forms, such as in pipes, hand-rolled leaves or as chewing tobacco. This is a key consideration in countries where alternative methods of tobacco use are prevalent, such as in Sweden30 and throughout much of Southern and Southeast Asia.31 , 32 The interested reader is referred in the first instance to the primary sources, which explain the parameters of each study.
The global impact of death and disease caused by tobacco smoking is discussed in Chapter 3, Section 3.36.

Figure 1.3.5 Prevalence of daily smoking among population aged 15+ in OECD countries , males and females

Figure 1.3.6 Prevalence of daily smoking among population aged 15+ in OECD countries
Figure 1.3.7 shows the prevalence of current smoking (daily, weekly, or less than weekly) from each of the major national surveys in Australia, the US, the UK, England, Canada and New Zealand since about 2010. As indicated in the notes below Figure 1.3.7, precise differences in rates of change in smoking prevalence in different countries cannot be reliably quantified due to methodological differences between surveys in different countries and between surveys in the same country. These differences include the methods by which data are collected, the inclusion or exclusion of different forms of tobacco products (e.g. some do and some do not include cigar and pipe smoking) and the phrasing of questions. There have also been some changes in methodology in the same surveys within the same country over time, and data collection for many of the surveys was impacted by COVID-19 in 2020–21. However each of these surveys do suggest a substantial decline in current smoking in all of these English-speaking countries over the past decade.

For each of the surveys, certain populations are excluded from sampling, such as those in institutional settings (e.g., people experiencing incarceration or in psychiatric facilities), those experiencing homelessness, and people in the Armed forces.
Error bars represent 95% confidence intervals.
i MOP UP and BUGA UP were acronyms for The Movement Opposed to the Promotion of Unhealthy Products and Billboard Utilising Graffitists Against Unhealthy Promotions respectively. Readers interested in the history and activities of these lobbying groups are referred in the first instance to: Chapman S. Civil disobedience and tobacco control: the case of BUGA UP (Billboard Utilising Graffitists Against Unhealthy Promotions). Tobacco Control 1996;5:179–85. Available from http://tobaccocontrol.bmj.com/cgi/reprint/5/3/179
Relevant news and research
For recent news items and research on this topic, click here. ( Last updated March 2024)
References
1. Australian Institute of Health and Welfare. Data tables: National Drug Strategy Household Survey 2019 - 2. Tobacco smoking chapter, Supplementary data tables. Canberra: AIHW, 2020. Available from: https://www.aihw.gov.au/reports/illicit-use-of-drugs/national-drug-strategy-household-survey-2019/data.
2. Australian Bureau of Statistics. Insights into Australian smokers, 2021-22, Snapshot of smoking in Australia. Canberra: ABS, 2022. Available from: https://www.abs.gov.au/articles/insights-australian-smokers-2021-22.
3. Woodward S. Trends in cigarette consumption in Australia. Australian and New Zealand Journal of Medicine, 1984; 14(4):405–7. Available from: http://www.ncbi.nlm.nih.gov/pubmed/6596048
4. Gray N and Hill D. Patterns of tobacco smoking in Australia. Medical Journal of Australia, 1975; 2(22):819–22. Available from: http://www.ncbi.nlm.nih.gov/pubmed/1207580
5. Gray N and Hill D. Patterns of tobacco smoking in Australia II. Medical Journal of Australia, 1977; 2(10):327–8. Available from: http://www.ncbi.nlm.nih.gov/pubmed/927253
6. Doll R and Hill A. A study of the aetiology of carcinoma of the lung. British Medical Journal, 1952; 2(4797):1271–86. Available from: http://www.ncbi.nlm.nih.gov/pmc/articles/PMC2022425/pdf/brmedj03472-0009.pdf
7. Wynder E and Graham E. Tobacco smoking as a possible etiologic factor in bronchogenic carcinoma. Journal of the American Medical Association, 1950; 143:329-36. Available from: https://www.ncbi.nlm.nih.gov/pmc/articles/PMC2623809/pdf/15744408.pdf
8. Royal College of Physicians, Smoking and health: a report of the Royal College of Physicians on smoking in relation to cancer of the lung and other diseases. London: Pitman Medical Publishing Co Ltd; 1962.
9. US Department of Health and Education and Welfare. Smoking and health. Report of the Advisory Committee to the Surgeon General of the Public Health Service. Rockville, Maryland: US Department of Health, Education and Welfare, Public Health Service, 1964. Available from: http://www.cdc.gov/tobacco/data_statistics/sgr/pre_1994/index.htm.
10. Australian Bureau of Statistics. 4380.0 Alcohol and tobacco consumption patterns, February 1977. Canberra: ABS, 1977.
11. Hill D, White V, and Scollo M. Smoking behaviours of Australian adults in 1995: trends and concerns. Medical Journal of Australia, 1998; 168:209-13. Available from: https://www.mja.com.au/journal/1998/168/5/smoking-behaviours-australian-adults-1995-trends-and-concerns
12. White V, Hill D, Siahpush M, and Bobevski I. How has the prevalence of cigarette smoking changed among Australian adults? Trends in smoking prevalence between 1980 and 2001. Tobacco Control, 2003; 12(suppl. 2):ii67-ii74. Available from: http://tobaccocontrol.bmj.com/cgi/content/full/12/suppl_2/ii67
13. Scollo M, Younie S, Wakefield M, Freeman J, and Icasiano F. Impact of tobacco tax reforms on tobacco prices and tobacco use in Australia. Tobacco Control, 2003; 12(suppl. 2):ii59–ii66. Available from: http://tc.bmjjournals.com/cgi/content/abstract/12/suppl_2/ii59
14. Wooldridge M. Preface, in Australia’s National Tobacco Campaign. Evaluation Report Volume One. Every cigarette is doing you damage. Hassard K, Editor Canberra: Commonwealth Department of Health and Aged Care; 1999. Available from: http://webarchive.nla.gov.au/gov/20140801095025/http://www.health.gov.au/internet/main/publishing.nsf/Content/health-pubhlth-publicat-document-metadata-tobccamp.htm.
15. The Social Research Centre. National Tobacco Survey: smoking prevalence and consumption, 1997-2005. Prepared for Research and Marketing Group, Information and Communication Division, Department of Health and Ageing, Darlinghurst NSW. Melbourne: The Social Research Centre, 2006.
16. Wakefield M, Coomber K, Durkin S, Scollo M, Bayly M, et al. Which policies reduce adult smoking prevalence? A time series analysis of Australian monthly adult smoking prevalence, 2001-2011. Bulletin of the World Health Organisation, 2014; 92(413–22). Available from: http://www.who.int/bulletin/volumes/92/6/13-118448/en/
17. Australian Bureau of Statistics. 4364.0.55.001 - National Health Survey: First Results, 2017-18 in ABS2018. Available from: http://www.abs.gov.au/ausstats/abs@.nsf/Lookup/by%20Subject/4364.0.55.001~2017-18~Main%20Features~Smoking~85.
18. Australian Institute of Health and Welfare. Australian Burden of Disease Study: Impact and causes of illness and death in Australia 2018. Canberra: AIHW, Australian Government 2021. Available from: https://www.aihw.gov.au/reports/burden-of-disease/abds-impact-and-causes-of-illness-and-death-in-aus/summary.
19. Banks E, Joshy G, Weber MF, Liu B, Grenfell R, et al. Tobacco smoking and all-cause mortality in a large Australian cohort study: findings from a mature epidemic with current low smoking prevalence. BMC Medicine, 2015; 13:38. Available from: http://www.ncbi.nlm.nih.gov/pubmed/25857449
20. The Tobacco Atlas, Prevalence. American Cancer Society & World Lung Foundation; 2022. Available from: https://tobaccoatlas.org/challenges/prevalence/.
21. Deaths, in The Tobacco Atlas2022, Vital Strategies
Tobacconomics Available from: https://tobaccoatlas.org/challenges/deaths/.
22. Hammond SK. Global patterns of nicotine and tobacco consumption. Handbook of Experimental Pharmacology, 2009; (192):3–28. Available from: http://www.springerlink.com/content/t353k255747342h6/
23. World Health Organization. The world health report 1999: making a difference. Geneva: World Health Organization, 1999. Available from: http://www.who.int/whr/.
24. Lopez A, Collishaw N, and Piha T. A descriptive model of the cigarette epidemic in developed countries. Tobacco Control, 1994; 3:242-7. Available from: http://tobaccocontrol.bmj.com/cgi/reprint/3/3/242.pdf
25. Shafey O, Dolwick S, and Guindon G, eds. Tobacco control country profiles. Atlanta, GA, American Cancer Society, World Health Organization, International Union Against Cancer;2003.
26. Asma S and Pederson L. Tobacco control in Africa: opportunities for prevention. Tobacco Control, 1999; 8:353-4. Available from: http://tobaccocontrol.bmj.com/cgi/content/full/8/4/353
27. Organisation for Economic Co-operation and Development and Health Division, Non-medical determinants of health: tobacco consumption. Paris: OECD; 2022. Available from: http://www.oecd.org/els/health-systems/health-data.htm.
28. The Global Health Observatory. SDG Target 3.a Tobacco control, Organization WH, Editor 2022: Geneva. Available from: https://www.who.int/data/gho/data/themes/topics/sdg-target-3_a-tobacco-control.
29. Foulds J, Ramstrom L, Burke M, and Fagerstrom K. Effect of smokeless tobacco (snus) on smoking and public health in Sweden. Tobacco Control, 2003; 12:349-59. Available from: http://tc.bmjjournals.com/cgi/content/abstract/12/4/349
30. National Cancer Institute and Stockholm Centre of Public Health. Smokeless tobacco factsheets. Prepared for the 3rd International Conference on Smokeless Tobacco. Atlanta, Georgia: Centers for Disease Control and Prevention, 2002. Available from: http://cancercontrol.cancer.gov/tcrb/stfact_sheet_combined10-23-02.pdf.
31. World Health Organization and International Agency for Research on Cancer. IARC monographs on the evaluation of carcinogenic risks to humans. Vol. 85: Betel-quid and areca-nut chewing and some areca-nut-derived nitrosamines. Summary of data reported and evaluation. Lyon: IARC, 2004. Available from: http://monographs.iarc.fr/ENG/Monographs/vol85/volume85.pdf.
32. Australian Bureau of Statistics. Pandemic insights into Australian smokers, 2020-21. 2021. Available from: https://www.abs.gov.au/articles/pandemic-insights-australian-smokers-2020-21.
33. Centers for Disease Control. National Health Interview Survey. 2022. Available from: https://www.cdc.gov/nchs/nhis/shs.htm.
34. Adjaye-Gbewonyo D and Boersma P. Early Release of Selected Estimates Based on Data From the 2020 National Health Interview Survey. National Helaht Interview Survey Early Release Program: U.S. Department of Health and Human Services, 2021. Available from: https://www.cdc.gov/nchs/data/nhis/earlyrelease/EarlyRelease202108-508.pdf.
35. National Cancer Institute. Tobacco Use Supplement to the Current Population Survey. 2021. Available from: https://cancercontrol.cancer.gov/brp/tcrb/tus-cps/questionnaires-data.
36. Office for National Statistics. Annual Population Survey. 2021. Available from: https://www.ons.gov.uk/peoplepopulationandcommunity/healthandsocialcare/healthandlifeexpectancies/datasets/smokinghabitsintheukanditsconstituentcountries.
37. Buss V, West R, Kock L, and Brown J. Annual trends on smoking in England from the Smoking Toolkit Study. 2023. Available from: https://smokinginengland.info/graphs/annual-findings.
38. Annual population survey (APS) QMI, 2012, Office for National Statistics. Available from: https://www.ons.gov.uk/employmentandlabourmarket/peopleinwork/employmentandemployeetypes/methodologies/annualpopulationsurveyapsqmi.
39. Office for National Statistics. Opinions and Lifestyle Survey. 2021. Available from: https://www.ons.gov.uk/peoplepopulationandcommunity/healthandsocialcare/drugusealcoholandsmoking/datasets/adultsmokinghabitsingreatbritain.
40. Opinions and Lifestyle Survey QMI, 2022, Office for National Statistics. Available from: https://www.ons.gov.uk/peoplepopulationandcommunity/healthandsocialcare/healthandlifeexpectancies/methodologies/opinionsandlifestylesurveyqmi#output-information.
41. Ministry of Health. New Zealand Health Survey. 2021. Available from: https://www.health.govt.nz/nz-health-statistics/national-collections-and-surveys/surveys/new-zealand-health-survey.
42. Ministry of Health. Methodology Report 2021/22: New Zealand Health Survey. Wellington: Ministry of Health, 2022. Available from: https://www.health.govt.nz/system/files/documents/publications/methodology_report_2021_22-_new_zealand_health_survey_11_nov.pdf.
43. Health Promotion Agency. Health and Lifestyles Survey. New Zealand 2021. Available from: https://tcdata.org.nz/HLS%20data/HLS_00.html.
44. Health Canada, Public Health Agency of Canada, Statistics Canada, and Canadian Institute for Health Information. Canadian Community Health Survey. 2021. Available from: https://www150.statcan.gc.ca/t1/tbl1/en/cv.action?pid=1310009601.
45. Health Canada. Canadian Tobacco Use Monitoring Survey (CTUMS). 2011. Available from: https://www.canada.ca/en/health-canada/services/publications/healthy-living/canadian-tobacco-use-monitoring-survey-2011-supplementary-tables.html.
46. Health Canada. Canadian Tobacco, Alcohol and Drugs Survey. 2021. Available from: https://www.canada.ca/en/health-canada/services/canadian-alcohol-drugs-survey.html.
47. Health Canada. Canadian Tobacco and Nicotine Survey 2021. Available from: https://www.canada.ca/en/health-canada/services/canadian-tobacco-nicotine-survey/2019-summary/2019-detailed-tables.html#t1.
48. Health Canada. Canadian Tobacco and Nicotine Survey (CTNS): Summary of results for 2021, 2023. Available from: https://www.canada.ca/en/health-canada/services/canadian-tobacco-nicotine-survey/2021-summary.html.